There are at least three reasons why you’d want to use Excel:
1. Functions: Math, Logic, Reference, Text, Statistics, and more.
2. Spiffy interface tools like AutoFill and Sort
3. The ability to recombine your raw data.
Excel is extremely good at generating, parsing, examining, adjusting, and recompiling data. If you’d like to do any of those things in an AutoCAD script, Excel can help you get there.
Let’s take an example:
Make an array of 100 squares where every square is 1 unit greater than the previous. Also, just to make it interesting, each rectangle is created at the ending point of the previous rectangle.
This is a simple task, entering it by hand, but you might die of boredom. A standard rectangular or polar array is simple in AutoCAD, there’s a tool for that. But this isn't a simple array. It is perfect for Excel, though.
Start by creating a table of values. We want the X and Y coordinates for the origins of the squares and the lengths of each side.
The initial point is at 0,0 and the initial lengths are both 1.
First, let’s take the squares. Each one increases by 1. This is a linear series. If we fill in the second row AutoFill will recognize the pattern quickly.
Do a basic Autofill: Select the cells with the initial numbers of your series. Click on the black square in the lower right corner. Drag downward and the values will automatically populate. More information is available in the Excel help files.
Second and a bit more difficult: the starting points for each square. Each new square begins where the old square ends. And the next square starts where the last square finished. This can be figured in a couple of ways
1. Xn equals the previous origin (Xn-1) plus the previous square length(Ln-1): Xn=Xn-1+Ln-1
2. Or Xn equals the sum of all the previous square lengths: Xn=Sum of Ln-1
I prefer the first way, and it is easier to get Excel to follow it. In order to get Excel to add the values in other cells you have to indicate the references, by calling out the cell names.
Here are our first three rows:
Note the formula for the current cell A4=A3+C3. The next cell down will be A5=A4+C4, and so forth.
Now you can AutoFill the origins for the x and y values. Your spreadsheet will now look something like this:
You’ve solved most of the problem. Here are all the values that change over time. Now you need to glue them together into something meaningful for AutoCAD to understand.
Putting it all together
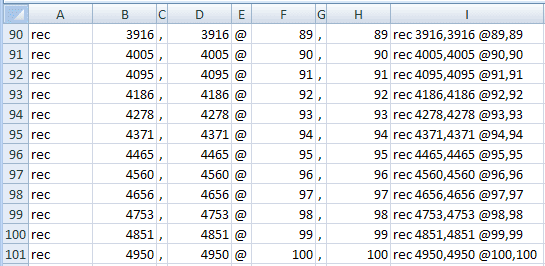
Now we’ve got all the data points we need we need glue them together with the commands that AutocAD understands. To do this we’ll use the =CONCATENATE() function. This function will take strings (or snippets of text) and combine them into a single string. These snippets can come from cells or from within the arguments of the CONCATENATE command
We’ll add the rectangle command, commas for point locations, and the @ symbol for relative coordinates. Finally we’ll add the spaces between quotes within the parenthesis.
Here’s how our first row looks.
Note the concatenate formula and how the result looks like something you might enter in AutoCAD.
Now Autofill the rest of the cells.

Copy the concatenated cells and paste them into the command line of AutoCAD (or create a script from them).
Your result should look like this. If it doesn’t, read the command line to find out what went wrong. I almost never get it exactly right on my first try.
I’ve created this script as a Google Doc Template that you can access. You can find it here:
https://docs.google.com/templates?q=rectangle_series&sort=hottest&view=public
This method can be applied to a wide range of problems. All you need are the following four things:
1. A problem that needs to be addressed multiple times (script worthiness)
2. A data source that can be viewed in a table (a list of some sort)
3. A pattern for adjusting that data (some sense of how things need to change)
4. An output that can be entered at a command line (usually created with the =CONCATENATE() function).
The next question is where should you pull your data from? I’ll leave that for my next post.


No comments:
Post a Comment